

Yes—a gamma flip can disappear from a map when the model no longer finds a change from negative to positive gamma exposure within the displayed price range. It can also disappear because the crossing moved outside that range, the options included in the calculation changed, or the display stopped showing it. In 2026, a missing line still does not prove that market risk disappeared or that price has a clear direction.
- A gamma flip disappears when the model finds no sign change within the displayed range—or cannot display one.
- Check gamma exposure, chart range, expiration filters, and data freshness before drawing a trading conclusion.
- FlowMonkey suits retail index-options traders looking for live gamma maps alongside real-time options flow alerts.
Can a gamma flip disappear from the map?
Yes. A gamma flip is an estimated price level where modeled aggregate gamma exposure changes sign. Gamma exposure, often shortened to GEX, estimates how sensitive an options portfolio's directional exposure is to changes in the underlying price.
That sounds technical. The practical question is simpler: under the model's assumptions, would dealers' hedge adjustments tend to lean against a price move or follow it?
FlowMonkey provides live gamma maps for SPY, SPX, QQQ, and IWM alongside real-time options flow alerts. Those are related views, not interchangeable signals: a gamma map estimates positioning, while options flow shows trading activity.
A missing flip needs a diagnosis before it needs a trade.
| What the map shows | What it means | What to check |
|---|---|---|
| Positive modeled GEX throughout the displayed range | No sign crossing appears inside that range | Wider price range and included expirations |
| Negative modeled GEX throughout the displayed range | No sign crossing appears inside that range | Wider price range and included expirations |
| A crossing on a wider view, but none on the narrow view | The flip sits outside the narrow display | Chart boundaries |
| A blank or incomplete chart | You cannot establish whether a crossing exists | Data status, filters, and display settings |
These are diagnostic possibilities, not measured outcomes. For your 2026 chart checks, preserve the same symbol, timestamp, and settings before comparing screenshots.
Why this matters
No flip is not the same as no gamma exposure. A curve can remain positive or negative across the entire visible range without ever crossing zero.
The distinction matters because a missing reference line can tempt you into inventing a replacement. Yesterday's flip is not automatically today's level. Neither is the nearest heavily traded strike.
Treat the map as a model with boundaries. Before interpreting the absence of a line, establish what the model actually calculated.
The flip moved outside the displayed range
A gamma map evaluates exposure over a selected range of possible underlying prices. If its estimated zero crossing falls beyond those boundaries, the visible chart can contain no flip even though a wider calculation contains one.
Hypothetical example—not a real session: an index chart displays 5,900 to 6,100 index points. The model's crossing sits at 6,120 index points. The flip is outside the window, not necessarily absent from the broader model.
Now imagine widening that same chart to include 6,120 index points without changing anything else. A newly visible crossing would explain the missing line. It would not establish that price will reach it.
Keep these checks separate:
- Chart range: Which possible underlying prices are visible?
- Price location: Where is the underlying trading within that range?
- Crossing location: Where does modeled exposure change sign?
Price does not need to trade through a flip for the model to estimate one. Likewise, a flip does not need to appear near the current price.
The model no longer contains a crossing
A zero crossing requires modeled exposure to change sign. If the curve stays on the same side of zero across the evaluated range, there is no gamma flip in that range.
Hypothetical example—not a real trade: a calculation evaluates an index from 5,900 to 6,100 index points and finds positive GEX throughout. Reporting no crossing is more accurate than forcing a line onto the chart.
The same logic applies to an entirely negative curve. The absence of a crossing tells you about the curve's shape, not the certainty of the next price move.
Positive GEX is not a promise of calm
Under a dealer-positioning model, positive dealer gamma implies hedge adjustments that tend to oppose price changes: selling as price rises and buying as price falls. That describes a potential stabilizing influence, not an instruction that price must stay inside a range.
News, trading activity, and other market participants still matter. A model's estimated hedging influence is not a price barrier.
Negative GEX is not a direction call
Under the same assumptions, negative dealer gamma implies hedge adjustments that tend to follow price changes. That can reinforce movement in either direction.
Negative does not mean bearish. It describes the modeled hedging response, not whether your next trade should be a put or a call.
Why the gamma flip varies
A gamma flip is an output of a calculation, not a permanent feature of an index. These factors explain why its location—or its presence—can change:
- Underlying price: Option gamma changes as the underlying moves relative to strike prices.
- Time remaining: Gamma changes as expiration approaches, especially around strikes near the underlying price.
- Included contracts: Different expiration and strike filters create different portfolios to evaluate.
- Positioning inputs: Changes in reported open interest affect calculations that use that data. Open interest means outstanding contracts, not today's trading volume.
- Model assumptions: A method must make assumptions about dealer positions that public contract totals do not fully reveal.
- Display boundaries: A chart can hide a crossing outside its evaluated or visible range.
A 2026 timestamp alone does not settle these questions. You need to know which inputs were updated and which settings produced the chart.
One particularly important distinction: option volume counts contracts traded during a period. Open interest counts outstanding contracts. A large burst of volume does not establish an equally large increase in open interest, because trades can open or close positions.
What should you check when the gamma flip disappears?
Use this sequence before changing your market view. It separates a changed estimate from a changed screen.
- Check the symbol. Confirm you are comparing the same instrument. SPY and SPX are different options markets; their levels are not interchangeable.
- Check the timestamp. Establish when the chart and its underlying inputs were updated. A live underlying quote does not prove every positioning input is live.
- Check the range. Widen the displayed price range if the interface permits it. Look for a crossing beyond the original boundaries.
- Check the filters. Compare the included expirations and strikes. Restore the previous settings before calling the difference a market change.
- Check the curve. Determine whether GEX remains positive, remains negative, or cannot be evaluated because the display is incomplete.
- Record the explanation. Save the timestamp, settings, and reason for treating the flip as absent. Do not replace an unexplained blank with conviction.
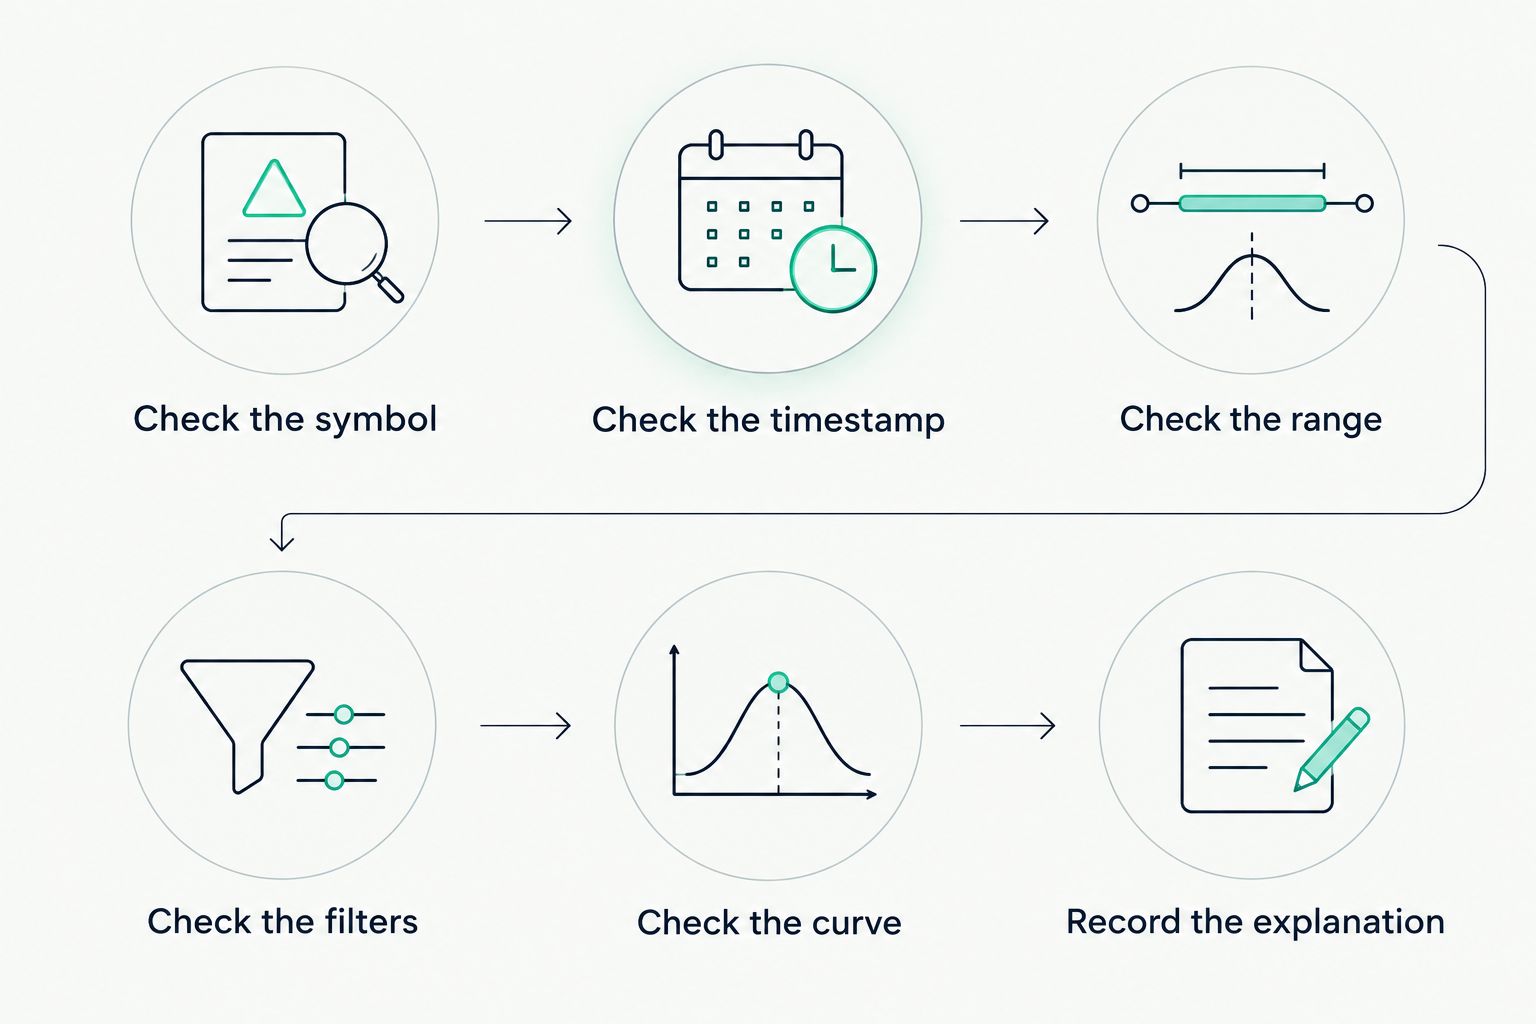
For a 2026 review log, keep the original screenshot alongside your notes. A record lets you distinguish what was visible at the time from what became obvious afterward.
Can expiration make a gamma flip disappear?
Yes. Expiration changes the set of outstanding options available to a calculation, and removing expiring contracts can change the shape of modeled GEX.
0DTE means zero days to expiration: options that expire that trading day. Near expiration, an option's gamma can be highly sensitive to the underlying's position relative to its strike, particularly near the money—when the underlying price is close to the strike price.
That does not mean every disappearing flip is a 0DTE story. First check whether the chart includes those contracts and whether your comparison uses the same expiration settings.
Hypothetical example—not a measured outcome: one chart includes options expiring today; another excludes them. A crossing appearing on only one chart does not prove either chart malfunctioned. The calculations cover different contract sets.
Does a missing gamma flip mean you should stop trading?
No. A missing gamma flip is not, by itself, a universal trade-or-stop rule. It does remove a reference point if your trading plan specifically depends on that crossing.
If your setup requires a confirmed flip and you cannot establish one, skip that setup rather than manufacture its missing condition. You can reassess after resolving the chart question.
That is different from declaring the whole market untradeable. Your decision should follow your written entry conditions and risk limits, not the urge to make every chart produce an answer.
Is a call wall a replacement for the gamma flip?
No. A call wall is a level identified by a tool's method as having concentrated call-option positioning or exposure. Its exact definition depends on the method, and it does not necessarily mark a change in aggregate gamma's sign.
A call option gives its holder the right to buy the underlying under the contract's terms. A strike is the contract's specified exercise price. Neither a concentration of calls nor a large trade at a strike automatically establishes a gamma flip.
| Reference | What it helps describe | Limitation |
|---|---|---|
| Gamma flip | A modeled change in aggregate gamma's sign | Depends on assumptions, inputs, and evaluated range |
| Call wall | A concentration identified under the tool's call-positioning method | Does not guarantee resistance or a sign change |
| Options flow | Contracts trading during the observed period | Does not reveal the full outstanding portfolio |
Use each reference for the question it actually answers. A missing flip does not turn a call wall into one.
How to evaluate the explanation, not just the line
A useful terminal should help you understand what a level means and when the interpretation fails. Coloured numbers are not an explanation.
FlowMonkey is for retail index-options traders who want live gamma maps and real-time options flow alerts in one terminal. The benefit is access to both views; the limitation is that neither view establishes every participant's position or guarantees a price move.
For your 2026 evaluation, ask for a plain-English explanation of the read and public examples of misses, not selected winning screenshots. Judge whether the explanation distinguishes observations from assumptions and states what would invalidate the interpretation.
If that matches how you want to learn, use a 7-day trial to evaluate the explanations before relying on the levels. Start by explaining a missing flip in your own words. A subscription should not substitute for understanding.
Examine the gamma-map explanation
Check the map, understand its limits, and decide whether the terminal fits your learning process.
FAQ
Can a gamma flip disappear even if the market barely moves?
Yes. A gamma flip can disappear because time, included contracts, positioning inputs, or model settings change, even without a large underlying-price move. Check those inputs before attributing the change to price.
Does no gamma flip mean gamma exposure is zero?
No. No gamma flip means no sign crossing was identified within the evaluated range, or the chart did not display one. Exposure can remain positive or negative throughout that range.
Can a gamma flip move outside my chart?
Yes. A modeled gamma flip can sit outside the chart's displayed price range. Widen the range while keeping the symbol, timestamp, and filters unchanged.
Is a gamma flip the same as a call wall?
No. A gamma flip marks a modeled change in aggregate gamma's sign, while a call wall identifies concentrated call positioning under a tool's method. Neither guarantees a price reaction.
Can I keep using yesterday's gamma flip?
Yesterday's gamma flip is not automatically valid today. Treat it as historical context until the current calculation supports the same crossing.
Does negative gamma mean the market will fall?
No. Negative dealer gamma describes a modeled hedging response that can reinforce movement in either direction. It is not a bearish forecast.
What should I check first on a missing gamma flip in 2026?
Check the symbol and timestamp first, then the chart range and expiration filters. Determine whether the curve lacks a crossing or whether the display lacks usable data.
One last thing
A line that disappears can be more informative than a line that never changes. The useful question is whether the calculation explains its absence.
Write down the reason before placing a trade that depends on the flip. If your explanation is only that the line used to be there, you have a screenshot—not a current signal.