Before trusting GEX levels in 2026, check the data timestamp, included expirations, dealer-position assumptions, and whether the explanation matches the current market. Treat each level as a conditional estimate—not a promise that price will stop, reverse, or accelerate there.
- Trust GEX levels only after checking freshness, expiration coverage, and dealer-position assumptions.
- FlowMonkey suits retail index-options traders who want gamma maps with a plain-English read and public accountability.
- Gamma exposure estimates hedging sensitivity; options flow shows trading activity, not a complete inventory of dealer positions.
- A gamma flip or call wall is context, not an instruction to enter a trade.
Why this matters
A precise-looking line can hide an imprecise assumption. Gamma exposure, shortened to GEX, estimates how options positions change the stock or index exposure that market makers need to hedge as the underlying market moves. Market makers are firms that quote options prices and often offset part of their risk elsewhere.
That estimate depends on both observable inputs and assumptions about who holds which positions. A chart can look clean while leaving those assumptions unexplained.
FlowMonkey provides live gamma maps for SPY, SPX, QQQ, and IWM alongside real-time options flow alerts. For a beginner evaluating gamma tools in 2026, the useful question is not how many lines appear. It is whether you can explain what would make a line stop mattering.
What should you check before trusting GEX levels?
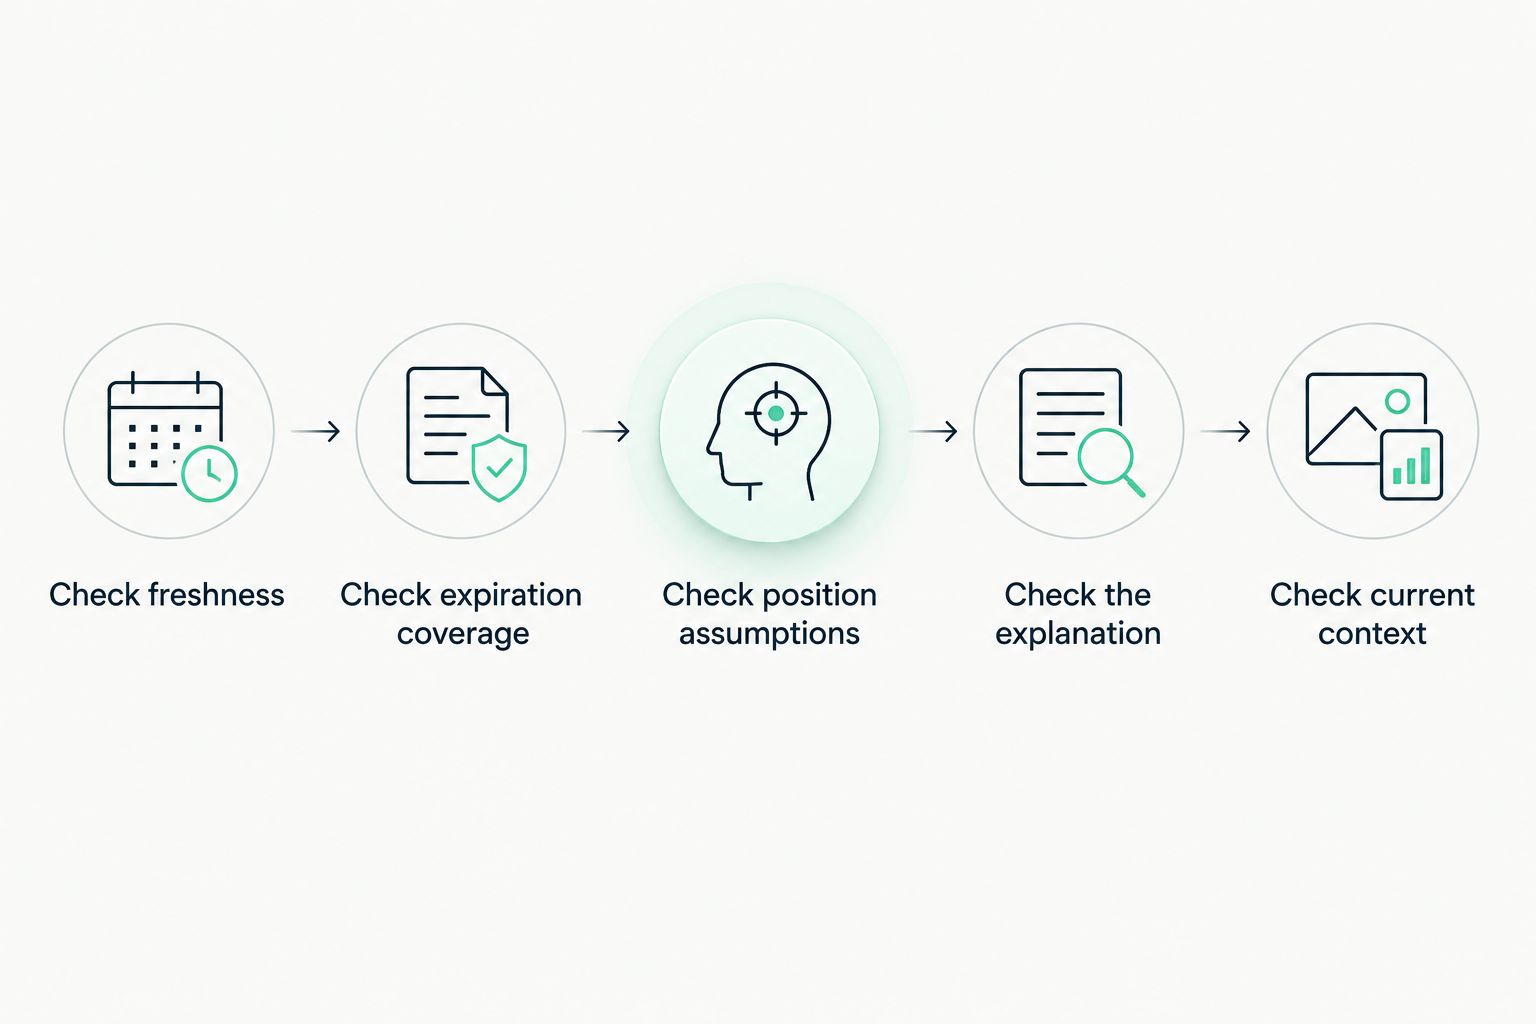
Use this sequence before letting a gamma map influence a decision. Do not skip straight to the most prominent level.
1. Check freshness
Find the timestamp attached to the calculation, not just the clock displayed on the page. Ask which inputs update during the session and which come from a previous snapshot.
Open interest means the number of outstanding options contracts. It is different from trading volume, which counts contracts traded during a period. A live underlying-market feed does not turn a prior open-interest snapshot into a live position ledger.
Hypothetical example: One map refreshed 3 minutes ago; another refreshed 30 minutes ago. The first has a more recent calculation, but that alone does not prove its position inputs are newer. Check what refreshed.
2. Check expiration coverage
An expiration is the date an option contract ends. 0DTE means zero days to expiration: options that expire during the current trading session.
Ask whether the map includes only today's contracts, several upcoming expirations, or a broader set. Those are different views of exposure. A near-expiration map and an all-expiration map can disagree without either containing a calculation error.
For your 2026 checklist, write the included expirations beside the timestamp. Without both, you cannot make a fair comparison.
3. Check position assumptions
A trade has a buyer and a seller. Public activity does not automatically reveal the full dealer position behind every contract.
Ask how the calculation assigns dealer ownership and exposure direction. Does it use a fixed convention, infer positions from trading activity, or describe another method? An undisclosed assumption is not a verified position.
You do not need to rebuild the model. You do need to know whether a positive or negative reading represents an observed position or an assumption used to estimate one.
4. Check the explanation
A usable read connects the level to a conditional mechanism. It should explain whose hedging is being estimated, how that hedging responds to a move, and what would invalidate the interpretation.
Under a positive dealer-gamma assumption, hedging tends to oppose market moves: selling into rises and buying into declines. Under a negative dealer-gamma assumption, hedging tends to reinforce moves instead. Other market activity can outweigh either effect.
Reject explanations that jump from a model estimate to certainty. A level is not a force field.
5. Check current context
Compare the level with the underlying market used to calculate it. SPX is an index; SPY is an exchange-traded fund. Their numerical levels are not interchangeable.
Then check whether the market has moved substantially since the calculation, whether the relevant expiration is still active, and whether a scheduled announcement changes the trading context. The interpretation belongs to that situation—not every chart carrying the same ticker.
Gamma flip: check the sign-change assumption
A gamma flip is an estimated underlying-market level where modeled net gamma changes sign. In plain English, it marks a possible change in the hedging behavior the model describes.
It is not automatically a reversal point. A market can cross the estimated flip without immediately changing direction, and the estimated flip can move as inputs change.
Hypothetical example: A map places the flip 10 index points below the current market. That distance describes where the estimate sits; it does not establish a safe entry, a loss limit, or the probability of reaching it.
Before using a gamma flip, ask:
- Which expirations contribute to the sign change?
- What dealer-position assumption determines the sign?
- When was the flip recalculated?
- Does the explanation describe a conditional change rather than a guaranteed move?
Use the gamma flip to frame a question about market behavior, not to answer every trading question.
Call wall: check what the concentration measures
A call wall commonly describes a strike with a large concentration of call-related exposure or activity. A call is an option giving its buyer the right to buy the underlying asset under the contract's terms; a strike is the contract's specified exercise level.
The label is not a universal calculation standard. Check whether the tool means call open interest, estimated call gamma exposure, or something else.
A large concentration does not automatically establish resistance—a level where upward movement stalls. The interpretation depends on position direction, expiration, and how the concentration changes.
Hypothetical example: A call concentration remains at the same strike while the market moves through it. The line did not malfunction merely because it failed to stop the move. The resistance interpretation failed; record that distinction.
Which information should you compare with a gamma map?
Different approaches answer different questions. Use this comparison to avoid asking any single display to provide evidence it does not contain.
| Approach | Best for | Useful contribution | Main limitation |
|---|---|---|---|
| Gamma map | Understanding estimated hedging context | Shows modeled exposure around underlying-market levels | Depends on coverage and position assumptions |
| Options flow | Examining current trading activity | Shows transactions and activity as they occur | A transaction does not establish the trader's entire position |
| Price chart | Checking observed market behavior | Shows whether the market actually reacts near a level | Does not explain who traded or why |
Options flow means recorded options trading activity. An alert about a large trade is evidence that activity occurred, not proof that the trade expresses a simple directional bet. It can belong to a hedge or a strategy involving several contracts.
A price chart adds a different kind of evidence: what the market actually did. Keep the distinction clean. A gamma map offers an estimate, flow shows transactions, and price shows the resulting market movement—not a complete explanation of its cause.
Why GEX levels vary
Two gamma maps can disagree because they answer different questions. In 2026, compare the calculation's scope before treating disagreement as proof that a provider is wrong.
- Expiration selection: Including or excluding near-expiration contracts changes the exposure being summarized.
- Position assumptions: Different assumptions about dealer holdings change the estimated sign and size of exposure.
- Refresh timing: Calculations made at different moments use different market conditions.
- Volatility inputs: Implied volatility—the volatility reflected in option prices—affects calculated option sensitivities.
- Time remaining: Options sensitivities change as expiration approaches; yesterday's interpretation is not automatically today's.
- Instrument selection: An index and an exchange-traded fund tracking that index have different contracts and numerical levels.
Do not average conflicting lines just to produce a single answer. First establish whether the maps share an instrument, timestamp, expiration set, and method. Otherwise, the average hides the disagreement instead of resolving it.
Does a fresh gamma map mean the positions are live?
No. A fresh calculation and a live position inventory are different things. A map can recalculate using current market inputs while still relying on an earlier open-interest snapshot and assumptions about dealer holdings.
Look for separate explanations of calculation timing and position-data timing. A refresh badge answers only the question its definition supports.
Can you trust a level after the market crosses it?
A crossing does not automatically invalidate the calculation, but it tests the interpretation. If the stated expectation was that the market would stall and it did not, record that as a failed expectation rather than rewriting the original claim.
Next, check whether the level or underlying assumptions changed. Keep the original read and the later update separate.
Should a beginner trade from GEX levels alone?
No. GEX levels do not define your acceptable loss or explain every source of market movement. Before risking money, understand the contract, expiration, position size, and exit conditions independently of the gamma map.
Use a written observation exercise first. Record the explanation before the market reaches the level, then compare it with what happened. That practice tests comprehension without confusing a convincing story with a tested trading rule.
How to evaluate the explanation before starting a trial
FlowMonkey suits retail index-options traders who want gamma maps with a plain-English read and public accountability. Its stated differentiation is the read explained in ordinary language and misses shown publicly. That gives beginners something more useful to assess than a screen full of colored numbers.
The limitation remains: a readable explanation does not remove model assumptions or trading risk. A subscription terminal supplies information; you still decide whether its scope and reasoning fit the decision you are making.
For an informed 7-day trial of FlowMonkey, keep a short observation log:
- Before: Save the timestamp, instrument, expiration scope, and stated expectation.
- During: Note whether the market approached the level and what the explanation predicted there.
- After: Separate a useful read, a failed read, and an outcome too ambiguous to grade.
In 2026, judge the explanation by whether you can understand and challenge it—not whether one successful call looked impressive. Misses belong in the record, not outside it.
Inspect the read before subscribing
Review FlowMonkey's gamma maps and explanations before deciding whether a 7-day trial fits your learning goals.
FAQ
What are GEX levels in plain English?
GEX levels are underlying-market levels associated with estimated gamma exposure from options positions. They help describe potential hedging behavior, not guaranteed destinations or turning points.
What's the first thing to check on a gamma map?
Check the calculation timestamp and what that timestamp actually measures. Then verify the age of position inputs and the included expirations.
Does positive gamma mean the market will rise?
No. Positive dealer gamma describes a hedging relationship, not a bullish forecast. Under that assumption, hedging tends to oppose market moves in either direction.
Is a call wall guaranteed resistance?
No. A call wall identifies a concentration under the provider's chosen calculation. Whether the market stalls there depends on more than the existence of that concentration.
Why do GEX levels change during the day?
GEX levels change when the inputs used to calculate them change. Underlying-market movement, volatility, time remaining, and updated activity estimates can alter the result.
Can I use an SPX gamma level directly on an SPY chart?
No. SPX and SPY are different instruments with different numerical levels and options contracts. Use the instrument specified by the calculation rather than copying the number across charts.
How should I evaluate a gamma tool in 2026?
Evaluate a gamma tool in 2026 by checking its data timing, expiration coverage, position assumptions, and record of explanations. Look for failed reads as well as successful ones, and keep risk decisions separate from the map.
One last thing
A level that moves after the market moves can look accurate in hindsight. That is why the saved explanation matters more than a later screenshot.
Before following a gamma read, write down what it expects and what would count against it. If nothing can count as a miss, nothing has been demonstrated.