

Gamma exposure data is fresh enough when its price inputs and calculation time match the decision you are making, and the age of its positioning inputs is disclosed. A recently refreshed screen is not enough: a live calculation can still use open interest from the previous completed session, so check what updated—not just when the display changed.
- Judge gamma exposure by input timestamps, calculation time, and positioning assumptions—not a flashing refresh indicator.
- Open interest and options flow answer different questions; live trades do not prove current dealer positions.
- For intraday decisions, check whether gamma levels recalculate as prices change and contracts expire.
- FlowMonkey fits retail index-options learners seeking live gamma maps with the read explained in plain English.
Why this matters
Gamma exposure, often shortened to GEX, estimates how options positions affect the buying or selling needed to adjust a hedge as the underlying price changes. A hedge is an offsetting position used to reduce risk. Dealers—the firms making markets in options—adjust those hedges, but a public gamma map does not reveal their complete books.
Your freshness check in 2026 needs to separate current market inputs from estimated positioning. Otherwise, a moving chart can make yesterday's positioning assumptions look like newly confirmed facts.
FlowMonkey provides live gamma maps for SPY, SPX, QQQ and IWM alongside real-time options flow alerts. Those capabilities address different questions: a gamma map estimates positioning effects; options flow records trading activity. Neither turns an estimated level into a guaranteed price move.
How do you tell whether gamma exposure data is fresh enough?
Check the inputs, then the calculation, then the interpretation. Use this sequence before relying on a gamma level for an intraday decision.
- Price time: Find the timestamp for the underlying price and options quotes. The underlying is the index or fund on which the options are based. Check whether the feed is live or delayed.
- Position date: Find the date of the open-interest input. Open interest is the number of outstanding contracts, not the number traded during the session.
- Calculation time: Check when the exposure estimate was recalculated. A fresh price beside an unchanged gamma calculation is not a fresh map.
- Expiry scope: Confirm which expiration dates the map includes and how it handles contracts expiring that day.
- Model assumptions: Read how the provider estimates dealer positioning. Identify whether intraday trades change that estimate or appear only in a separate activity feed.
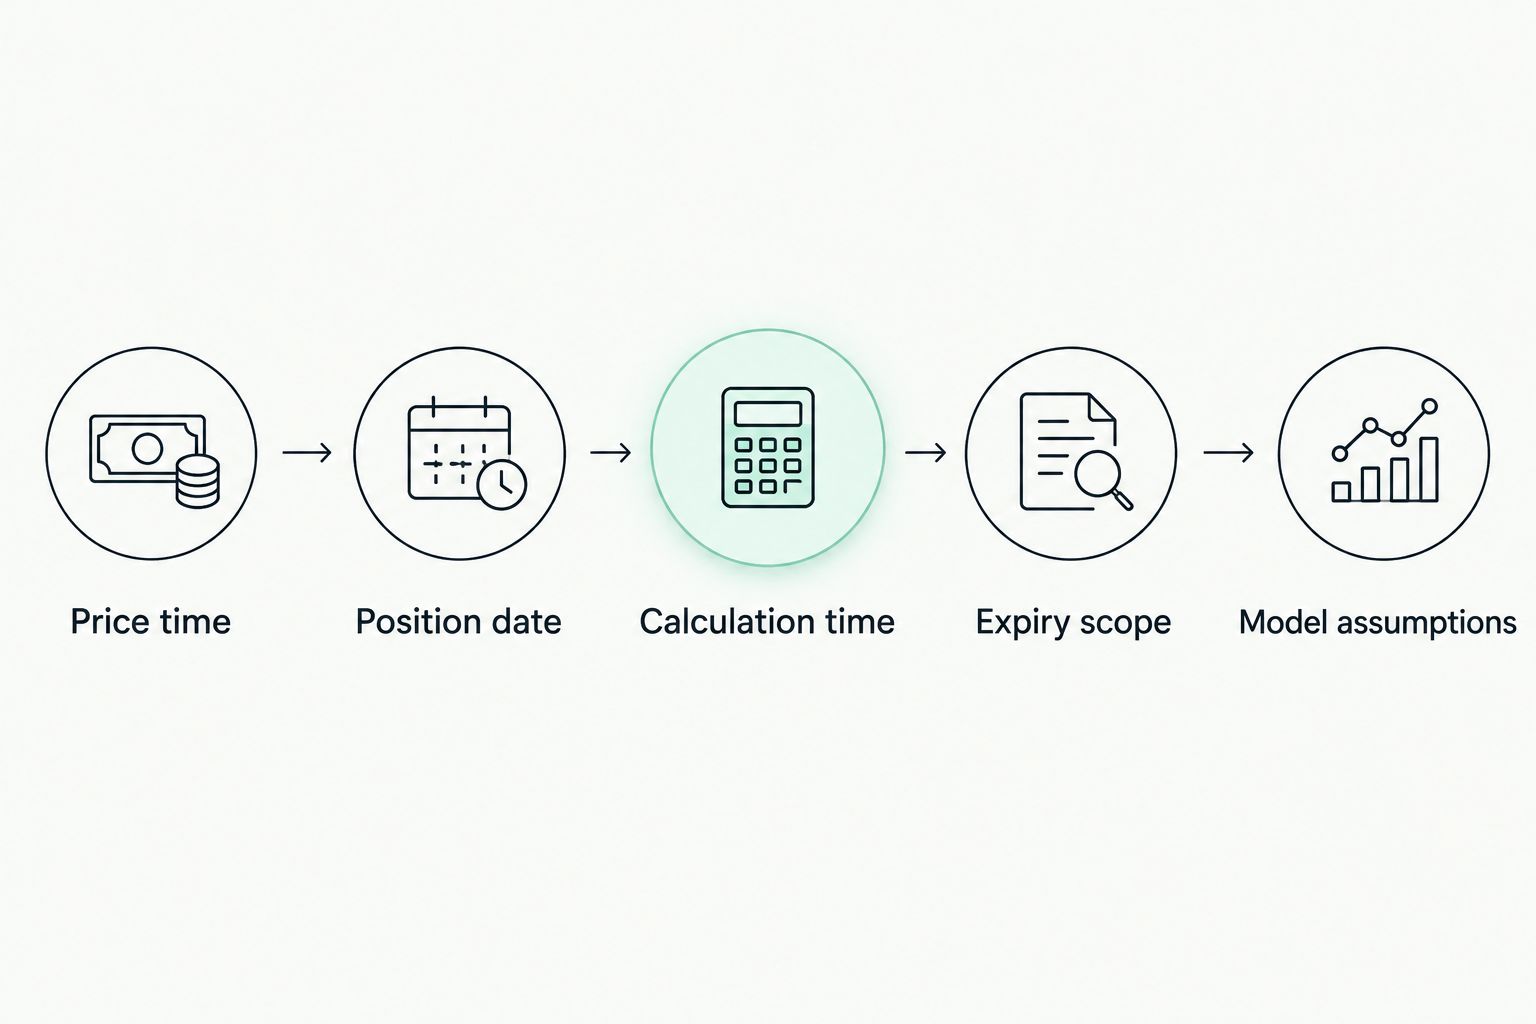
If a provider does not disclose one of these details, treat that part of the freshness claim as unverified. You do not need to guess what a refresh button means. You need an explanation of which inputs it refreshes.
A hypothetical timestamp check
Suppose you inspect a map at 10:00 a.m. The underlying price is 30 seconds old, the gamma calculation is 2 minutes old, and the options quotes are delayed by 15 minutes. These are hypothetical timestamps, not product specifications or recommended cutoffs.
The freshest visible number does not settle the question. The map combines inputs from different moments, so its displayed calculation time alone cannot establish that it reflects current option pricing.
Now suppose the prices and calculation are current, but open interest comes from the previous completed session. That is a different limitation: the map updates the estimated sensitivity of an older positioning snapshot. It does not establish who holds every contract now.
Which kind of gamma exposure update are you looking at?
Gamma measures how quickly an option's price sensitivity changes as the underlying moves. That price sensitivity is called delta. Gamma exposure combines those sensitivities with position estimates, so both market conditions and positioning assumptions matter.
Use this comparison when assessing a gamma tool in 2026. Different update methods provide different evidence—not interchangeable versions of the same live feed.
| Approach | Best suited to | What it tells you | Main limitation |
|---|---|---|---|
| Prior-session snapshot | Studying the starting positioning picture | Exposure estimated from a defined historical input set | Does not incorporate subsequent price changes unless recalculated |
| Recalculated open-interest map | Following how estimated exposure changes with market prices | Updated sensitivity using disclosed open-interest inputs | Current prices do not establish current ownership |
| Trade-informed positioning estimate | Studying a model's intraday adjustments | Exposure adjusted using assumptions about observed trades | Trade direction and opening-versus-closing classifications remain assumptions |
| Options flow feed | Inspecting individual trades and trading activity | Transactions recorded during the session | Trades alone do not reveal the full dealer inventory |
Prior-session snapshot: a starting point, not a live read
A fixed snapshot gives you a consistent reference for studying the session's starting conditions. That consistency is useful when comparing an earlier expectation with what actually happened.
Its weakness is equally clear. If price moves substantially or relevant contracts expire, an unchanged snapshot does not describe a recalculated exposure estimate. Keep it as context, not proof that the same interpretation still applies.
Recalculated map: current sensitivities, older positioning inputs
A recalculated map updates estimated exposure as its market inputs change. That helps you distinguish an unchanged contract count from changing sensitivity: the same outstanding contracts can contribute different exposure as price and time change.
The limitation sits in the positioning estimate. Recalculating exposure does not verify who currently owns the contracts. Look for both the calculation timestamp and the open-interest date.
Trade-informed estimate: more inputs, more assumptions
An intraday model can use observed trades to adjust its positioning estimate. That adds information about activity after the starting snapshot.
It also adds classification choices. A trade print does not, by itself, prove whether a participant opened or closed a position, or how that position fits into a larger strategy. Ask what the model assumes before treating its adjustment as confirmed inventory.
Why gamma exposure freshness varies
There is no universal freshness cutoff that makes every gamma map suitable for every decision. The inputs, method and intended use determine what its timestamp actually means.
- Feed delay: A calculation performed now can still use delayed underlying prices or options quotes.
- Open-interest publication: Open interest is generally a daily input rather than a continuously updated public inventory of all positions.
- Recalculation schedule: A provider can refresh prices separately from the exposure calculation or written interpretation.
- Expiration coverage: Including or excluding near-expiry contracts changes the exposure being estimated.
- Positioning assumptions: Different assumptions about who holds options change the sign and size of estimated dealer exposure.
- Scope changes: A map covering selected expirations is not directly equivalent to one covering the full set of listed expirations.
For your 2026 checklist, record these factors together. A timestamp without scope or methodology gives you less information than it appears to.
Is yesterday's open interest too old for today's gamma map?
Yesterday's open interest can support a current gamma calculation, provided its age is disclosed. The calculation can update how those outstanding contracts respond to current market conditions without claiming that the positioning snapshot itself is live.
This distinction matters because fresh calculation and fresh positioning evidence are separate claims. A tool should tell you which claim it makes.
A useful beginner question is: “Does this map recalculate yesterday's positions, estimate today's position changes, or both?” The answer tells you more than a generic live-data badge.
Does a fast refresh make a gamma flip reliable?
A fast refresh makes the displayed estimate more recent; it does not make a gamma flip certain. A gamma flip is the underlying price at which the model's estimated net gamma exposure changes sign.
The sign matters because positive and negative dealer gamma imply different hedging responses under the model's assumptions. Positive gamma is associated with hedging against price moves; negative gamma is associated with hedging in their direction. Actual market behavior also depends on positioning the model cannot fully observe.
A call wall is a label commonly used for a strike with a large concentration of call-related positioning or exposure. Definitions vary by provider. A current call wall is still an estimated concentration—not a barrier that price must respect.
Do not confuse a recent estimate with a dependable price barrier. Check the definition, the calculation time and the assumptions before interpreting either label.
Do same-day options need a different freshness check?
Same-day options need particular attention to price, time and expiration handling. 0DTE means zero days to expiration: the option expires that trading day.
As expiration approaches, an option's sensitivities can change sharply near its strike price—the price at which the contract can be exercised. That makes a stale calculation especially difficult to interpret during a moving market.
For a 0DTE decision in 2026, check whether the map includes today's expiration and when it recalculated. Also check when those contracts stop contributing to the displayed exposure. Do not assume a map labeled “all expirations” explains its end-of-session handling.
A hypothetical level-change example
Imagine a map initially places a gamma flip below the underlying price. Later, the underlying moves toward that level while the model recalculates using new quotes and less time to expiration. The estimated flip changes.
That change is not automatically a data error. It can result from changed inputs. The useful question is whether you can distinguish an input-driven recalculation from a change in the provider's positioning assumptions.
How to evaluate the explanation, not just the feed
A beginner needs to understand what the map says before deciding whether its update speed is useful. Start with the plain-English read: which conditions does the interpretation describe, and what would make it wrong?
Then inspect accountability. An explanation that preserves misses gives you a way to examine mistakes; a collection of successful screenshots does not show the full record. Public misses are evidence to inspect, not a promise about the next session.
FlowMonkey pairs gamma maps with a plain-English read and public accountability around misses. Its fit is retail index-options traders learning what the levels mean; its limitation is the same boundary every gamma interpretation faces: estimated exposure is not a verified dealer book or a trading guarantee.
If that matches what you need, use the 7-day trial to assess understanding rather than hunt for a winning screenshot. Check whether you can explain the input dates, the level definitions and the conditions that invalidate a read. Those are concrete reasons to keep—or reject—a tool.
Inspect the read before trading
Explore the gamma maps, plain-English explanation and public misses before choosing a trading workflow.
FAQ
How can I tell whether gamma exposure data is live?
Check the underlying-price timestamp, options-quote timestamp and gamma-calculation timestamp separately. Then check the open-interest date and whether intraday trades adjust the positioning estimate; a live display does not make every input live.
Is a gamma map using yesterday's open interest useless?
A gamma map using yesterday's open interest can still provide a recalculated estimate using current market inputs. Its limitation is that current sensitivities do not establish current ownership or all intraday position changes.
How often should gamma exposure data update?
Gamma exposure data should update often enough to reflect the market conditions relevant to your decision, with its timing disclosed. There is no universal interval that proves a map is suitable for every strategy; inspect feed delays, calculation timing and expiration handling.
Does unusual options activity prove dealers changed their positions?
Unusual options activity does not prove how dealers' net positions changed. A trade record shows activity, but opening-versus-closing status, counterparties and related positions affect its interpretation.
Can I trade whenever price crosses the gamma flip?
A gamma-flip crossing is not a standalone trade instruction. The level marks a sign change in a model's estimated exposure, not a guaranteed change in price behavior.
What should I check before using a 0DTE gamma map?
Check that the map includes the same-day expiration, uses appropriate market inputs and explains when expiring contracts leave the calculation. Zero days to expiration describes the contract's remaining life, not the freshness of the data.
Who is FlowMonkey's gamma exposure terminal suited to?
FlowMonkey's gamma exposure terminal fits retail traders learning US equity index options who want live maps with plain-English interpretation. Use the trial to assess whether you understand the read and its limitations, not as evidence of future trading profits.
One last thing
A moving gamma level is not automatically a faulty gamma level. Gamma measures changing sensitivity, so updated prices and the passage of time can change the estimate even when the positioning input stays fixed.
For every map you assess in 2026, write down three things before acting: the input date, the calculation time and what would invalidate your interpretation. If you cannot explain those, a faster refresh is not the missing ingredient.