

Two gamma exposure charts can show different numbers because they use different position assumptions, option expirations, timestamps, market inputs or measurement units. A mismatch does not automatically mean either chart is wrong, but neither chart proves how dealers are positioned or where the market must move.
- Compare a gamma exposure chart only after matching its units, timestamp, expirations and position assumptions.
- Gamma exposure, or GEX, estimates how option sensitivity changes as the underlying market moves.
- A gamma flip depends on the calculation; it is not a guaranteed turning point.
- Flowmonkey suits beginners seeking gamma maps with the read explained in plain English.
Why this matters
A gamma chart compresses a complicated options calculation into bars, lines and levels. That is useful. The trouble starts when you compare two pictures without comparing what went into them.
For your 2026 chart checks, start with the timestamp and the calculation notes—not the brightest bar. The guide to whether gamma exposure data is fresh enough explains why a current-looking display and current position information are different things.
A chart is an estimate with assumptions, not a live inventory of every dealer's positions. Once you understand that distinction, conflicting numbers become something you can investigate rather than something you have to trust blindly.
Why can two gamma exposure charts show different numbers?
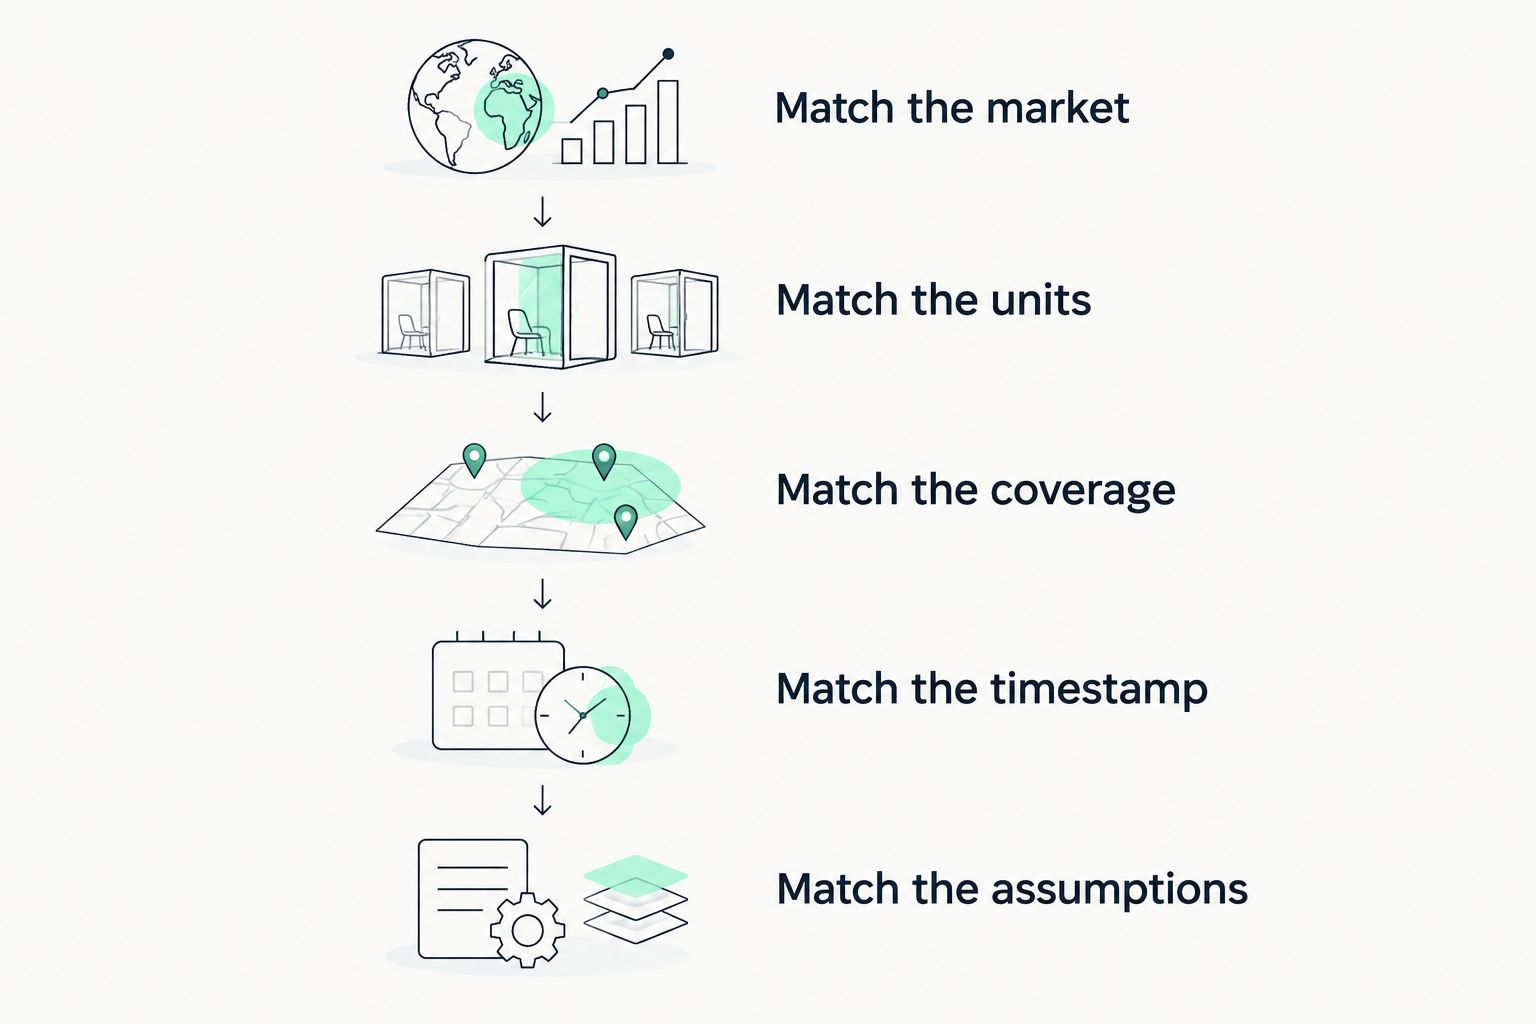
Two charts differ when their inputs, coverage or calculations differ. Use this sequence before deciding that one reading contradicts the other:
- Match the market. Confirm both charts cover the same underlying instrument. SPY and SPX track related markets, but their options are not interchangeable contracts.
- Match the units. Check whether the display shows share exposure, dollar exposure, or exposure for a specified market move.
- Match the coverage. Compare the included expirations and strike prices—the exercise prices written into the contracts.
- Match the timestamp. Check when the chart refreshed and when its position inputs were last updated.
- Match the assumptions. Read how the calculation assigns positive and negative positions and estimates option sensitivities.
Do these checks in order. A units mismatch can explain an apparent disagreement before you spend time comparing individual bars.
What does gamma exposure actually measure?
An option is a contract whose value depends partly on an underlying security or index. Delta measures how much an option's theoretical value changes for a small move in that underlying market. Gamma measures how delta changes as the underlying moves.
Gamma exposure, shortened to GEX, scales gamma across positions or assumed positions. It estimates how sensitive those positions become as the market moves. It does not directly measure tomorrow's buying, selling or price direction.
A dealer is a market participant that buys and sells options, often while managing the resulting risk. Dealers can hedge by trading the underlying market or related instruments. A gamma chart models part of that relationship; it does not reveal every hedge already in place.
Different measurements answer different questions
Before choosing a chart for your 2026 trading routine, identify the measurement you need. A larger displayed number is not automatically more useful.
| Measurement or coverage | Useful for | Strength | Limitation |
|---|---|---|---|
| Net gamma exposure | Reading the estimated overall balance | Offsets positive and negative contributions | Can hide large opposing exposures |
| Gross gamma exposure | Seeing the scale of exposure before netting | Keeps offsetting contributions visible | Does not describe the signed balance alone |
| Exposure by strike | Finding where modeled exposure clusters | Shows concentrations at particular exercise prices | A large bar does not guarantee a price reaction |
| Same-day expiration only | Examining contracts expiring that session | Isolates the shortest-dated contracts | Excludes later expirations |
| Multiple expirations | Examining a broader set of contracts | Includes exposure beyond the current session | Can obscure the same-day contribution |
Net and gross are not competing answers to the same question. Netting subtracts opposing signed contributions. A gross measure aggregates their magnitude without the same cancellation; check the provider's definition.
Expiration coverage creates another distinction. An option's expiration is when the contract ends. 0DTE means zero days to expiration: the option expires that trading day.
A chart limited to 0DTE options and a chart including later expirations can produce different totals without either calculation containing an error. Compare like with like before drawing a conclusion.
Why gamma exposure varies between charts
These factors explain why matching the ticker alone is not enough:
- Position assumptions. Public open interest does not identify which contracts dealers own or have sold. Charts that infer those positions can assign different signs to the same contracts.
- Position-data timing. Open interest counts outstanding contracts and is generally reported on a daily cycle. A chart can refresh market inputs during the session without having a complete intraday position inventory.
- Option-model inputs. Gamma calculations depend on inputs including the underlying level, time remaining and implied volatility—the volatility reflected in option prices. Different inputs produce different sensitivities.
- Contract coverage. Included expirations, strike ranges and treatment of adjusted contracts change the set being added together.
- Units and aggregation. Contract multipliers, market-move scaling and net-versus-gross treatment change the displayed result. Some differences are conversions; others change the question being answered.
Calls and puts do not reveal who owns the risk
A call gives its buyer the right to buy under the contract's terms. A put gives its buyer the right to sell. For standard purchased calls and puts, gamma is positive; selling those options reverses the position's gamma sign.
That means a put is not inherently negative gamma simply because it is a put. A chart that assigns opposite signs to call and put open interest is applying a position assumption, not discovering ownership from the contract label.
Ask how the chart assigns dealer positions. If that explanation is missing, the sign of the total deserves less confidence—not more dramatic interpretation.
A hypothetical example: same market, different scaling
Hypothetical example—not a real trade, forecast or measured result. Imagine an index at 5,000 points. A move of 1% equals 50 index points, taking that index to 5,050 points if it rises.
A chart expressing hedge sensitivity for a 1-point move is not using the same scale as a chart expressing it for a 1% move. Even before other adjustments, those reference moves differ substantially at that index level.
Now add contract size. A standard, unadjusted US equity option contract generally represents 100 shares. Omitting that multiplier when comparing contract-level and share-level figures creates another mismatch; adjusted contracts require their own specifications.
Dollar-based measures can also convert underlying exposure into a monetary amount. Do not compare that figure directly with a share count or a raw gamma total.
The lesson for 2026 is simple: read the unit attached to the number. A total without its measurement basis is not enough to compare charts, even when the ticker and timestamp match.
Why can two charts show a different gamma flip?
A gamma flip is the underlying price where modeled net gamma changes sign. Two charts can place it differently because their position assumptions, expiration coverage or calculations differ.
Some calculations estimate exposure across a range of hypothetical underlying prices to find that crossing. Results depend on what the model recalculates and what it holds constant. A flip derived this way is a model output, not a price printed by the exchange.
Positive dealer gamma is commonly associated with hedging that sells into rises and buys into declines. Negative dealer gamma reverses that basic hedging tendency. Those descriptions assume the modeled dealer position is correct and do not account for every force moving the market.
A gamma flip is context, not an instruction to buy or sell. Crossing a modeled level does not guarantee that a market will accelerate, reverse or remain on one side of it.
Why can two charts identify a different call wall?
A call wall is a chart provider's label for a prominent concentration of call-related exposure or positioning at a strike. The definition is not universal, so different charts can select different levels.
One calculation can emphasize call open interest while another emphasizes modeled gamma exposure. Those are different measurements. A concentration of contracts does not necessarily equal the largest contribution to gamma.
For a 2026 comparison, read the definition before using the label. A call wall is not a literal barrier, and price can move through it. Treat an unexplained label as an unanswered methodology question.
How should a beginner choose which chart to use?
Choose the chart you can explain back in plain English. You should know what it measures, which contracts it includes, when its inputs update and where its assumptions can fail.
Use this short acceptance test:
- Can you identify the underlying instrument and included expirations?
- Can you explain the displayed units without guessing?
- Can you distinguish a display refresh from a position-data update?
- Can you find the method used to assign position signs?
- Can you review the interpretation against what actually happened, including misses?
Do not choose whichever chart matches a trade you already want to take. That replaces analysis with confirmation.
Flowmonkey provides live SPY, SPX, QQQ and IWM gamma maps alongside real-time options-flow alerts. Options flow means reported options trading activity; it adds transaction context but does not reveal every trader's purpose.
Flowmonkey is for beginners who want gamma maps with the read explained in plain English. Judge the interpretation by its explanation and its publicly shown misses, not by a promise of profits. The limitation remains: a terminal cannot turn estimated positioning into certain ownership or guaranteed price moves.
If you are considering the 7-day trial, use it to practice explaining a reading before considering a trade. Write down the timestamp, units, included expirations and what would contradict your interpretation. That makes the trial an evaluation rather than a hunt for a winning signal.
Examine the read before trading
Review the gamma maps and explanations, then decide whether the approach fits your learning process.
FAQ
Does a different gamma exposure chart number mean one chart is wrong?
A different gamma exposure chart number does not establish an error. First match the underlying, units, timestamp, included contracts and position assumptions; only then compare the result.
Can two gamma charts disagree even when they update together?
Two gamma charts can disagree at the same update time because they use different position assumptions, model inputs or contract coverage. A matching display timestamp does not establish matching source data.
Is negative gamma a signal that the market will fall?
Negative gamma is not a prediction that the market will fall. Under a negative-dealer-gamma assumption, hedging can reinforce moves in either direction rather than identifying which direction comes next.
Does open interest show whether dealers bought or sold the options?
Open interest does not identify whether dealers bought or sold the outstanding options. Inferring dealer exposure requires additional information or assumptions, which is why the chart's methodology matters.
Should I use a same-day chart or an all-expiration chart?
Use a same-day chart to isolate contracts expiring that session and a broader chart to examine included later expirations. Neither replaces the other, and their totals should not be treated as interchangeable.
Can Flowmonkey gamma maps guarantee a move at a level?
Flowmonkey gamma maps cannot guarantee a price move. Use the explanation as market context, check the assumptions and keep a separate risk plan for any trade.
One last thing
For your 2026 chart comparisons, save the methodology beside the screenshot. Record the units, expiration coverage, timestamp and position-sign assumption before the session outcome is known.
That small habit changes the question from whether a line looked convincing to whether the interpretation was testable. Receipts beat a convincing screenshot.