
Yes. SPX gamma exposure can change before yesterday’s high, low, or mapped gamma levels break because option sensitivities change with time, implied volatility, and the index itself, while trading changes outstanding positions. Yesterday’s levels remain useful reference points, but they do not freeze today’s hedging conditions or guarantee a price reaction.
- SPX gamma exposure can change inside yesterday’s range; a price breakout is not required.
- GEX estimates depend on option sensitivities, position assumptions, expiration coverage, and data freshness.
- A gamma flip or call wall is a model reference, not a guaranteed turning point.
- FlowMonkey suits retail index-options traders who want live gamma maps alongside real-time options flow alerts.
Can SPX gamma exposure change before yesterday’s levels break?
Yes. Gamma exposure, often shortened to GEX, estimates how option positions’ sensitivity to price changes translates into potential hedging pressure. SPX refers to options on the S&P 500 Index. A gamma map organizes those estimates around index levels, usually the strikes where options can be exercised.
The key distinction is simple: an unchanged price range does not mean unchanged options exposure. For your 2026 trading checklist, start with whether gamma exposure data is fresh enough, not whether yesterday’s lines still look tidy.
| Reference | What it tells you | Useful for | Main limitation |
|---|---|---|---|
| Yesterday’s high and low | Where the index traded during the previous session | Locating the current price within a historical range | Does not measure current option sensitivities |
| Yesterday’s gamma map | An exposure estimate using an earlier snapshot | Comparing how the estimated structure has changed | Can be stale without any range breakout |
| Current gamma map | An estimate using the provider’s latest inputs | Checking present modeled hedging conditions | Still depends on assumptions and data coverage |
| Current options flow | Reported option transactions | Investigating activity near relevant strikes | Does not establish the full position or trader intent |
Why this matters
If you wait for yesterday’s range to break before reassessing gamma, you can miss a change in the conditions behind that range. Price describes what the index has done. Gamma estimates describe how certain option positions respond as price moves.
Neither replaces the other. A current map gives context for a trading decision; it does not make the decision or establish an edge by itself.
For a beginner learning SPX gamma exposure in 2026, this distinction prevents a common mistake: treating a line on a chart as a standing instruction to buy or sell. Keep the reference level. Recheck the explanation attached to it.
What actually changes when gamma exposure changes?
Start with delta: an option’s estimated sensitivity to a move in its underlying index. Gamma describes how much that delta changes for a 1-index-point move, with other inputs held constant. Gamma itself also changes as market conditions change.
A trader or dealer who offsets option risk adjusts a hedge as delta changes. Dealers are market participants that facilitate trading and can hold positions requiring those adjustments. A gamma-exposure model tries to estimate the resulting sensitivity across many contracts.
That involves more than plotting the index against a fixed strike. The model needs option sensitivities, position sizes, contract specifications, and assumptions about which side holds the exposure.
Positive gamma and negative gamma are different conditions
Under a simplified dealer-hedging model, a dealer with positive gamma sells underlying exposure into a rise and buys into a decline to maintain a delta-neutral hedge. Delta-neutral means offsetting the position’s current directional sensitivity.
A dealer with negative gamma adjusts in the opposite direction: buying into rises and selling into declines. These are conditional hedging relationships, not promises about the market’s next move.
Other trading can outweigh that activity. A positive modeled reading does not make a rally impossible, and a negative reading does not require a selloff.
Why SPX gamma exposure varies inside yesterday’s range
These factors can change the estimate without a break of yesterday’s high or low:
- Time remaining: Option sensitivities change as expiration approaches. The effect is particularly important near the strike as the remaining time becomes short.
- Implied volatility: This is the volatility reflected in option prices. Changes in implied volatility alter calculated gamma even when the index stays within its previous range.
- Price within the range: An index can move closer to or farther from important strikes without breaking yesterday’s boundaries. That changes the sensitivity of those options.
- Position changes: New positions, closing trades, and expiration change the contracts contributing to exposure. A public feed does not necessarily reveal those changes immediately or completely.
- Model inputs: Expiration coverage, data timestamps, and dealer-position assumptions affect the displayed estimate. A changed calculation is not automatically evidence of a changed market position.
Do not mix these explanations together. A sensitivity-driven change and a newly observed position change can produce a similar-looking chart update, but they support different conclusions.
A hypothetical session with no range breakout
Hypothetical example—not a real trade or measured outcome: SPX opens inside yesterday’s range. Yesterday’s map showed a prominent concentration of estimated exposure near a strike above the index. The index remains below that strike throughout the morning.
As expiration gets closer, the model recalculates the options’ sensitivities. Implied volatility also changes, and fresh trades appear near the same strike. The updated map shows a different exposure concentration even though neither yesterday’s high nor yesterday’s low has broken.
The correct conclusion is narrow: the current estimate differs from the earlier snapshot. The update alone does not tell you that dealers changed sides, that the observed trades opened new positions, or that a breakout must follow.
Compare matching expirations and timestamps before assigning a cause. Otherwise, you risk explaining a difference in chart settings as a change in trader behavior.
How do you check whether a gamma change is meaningful?
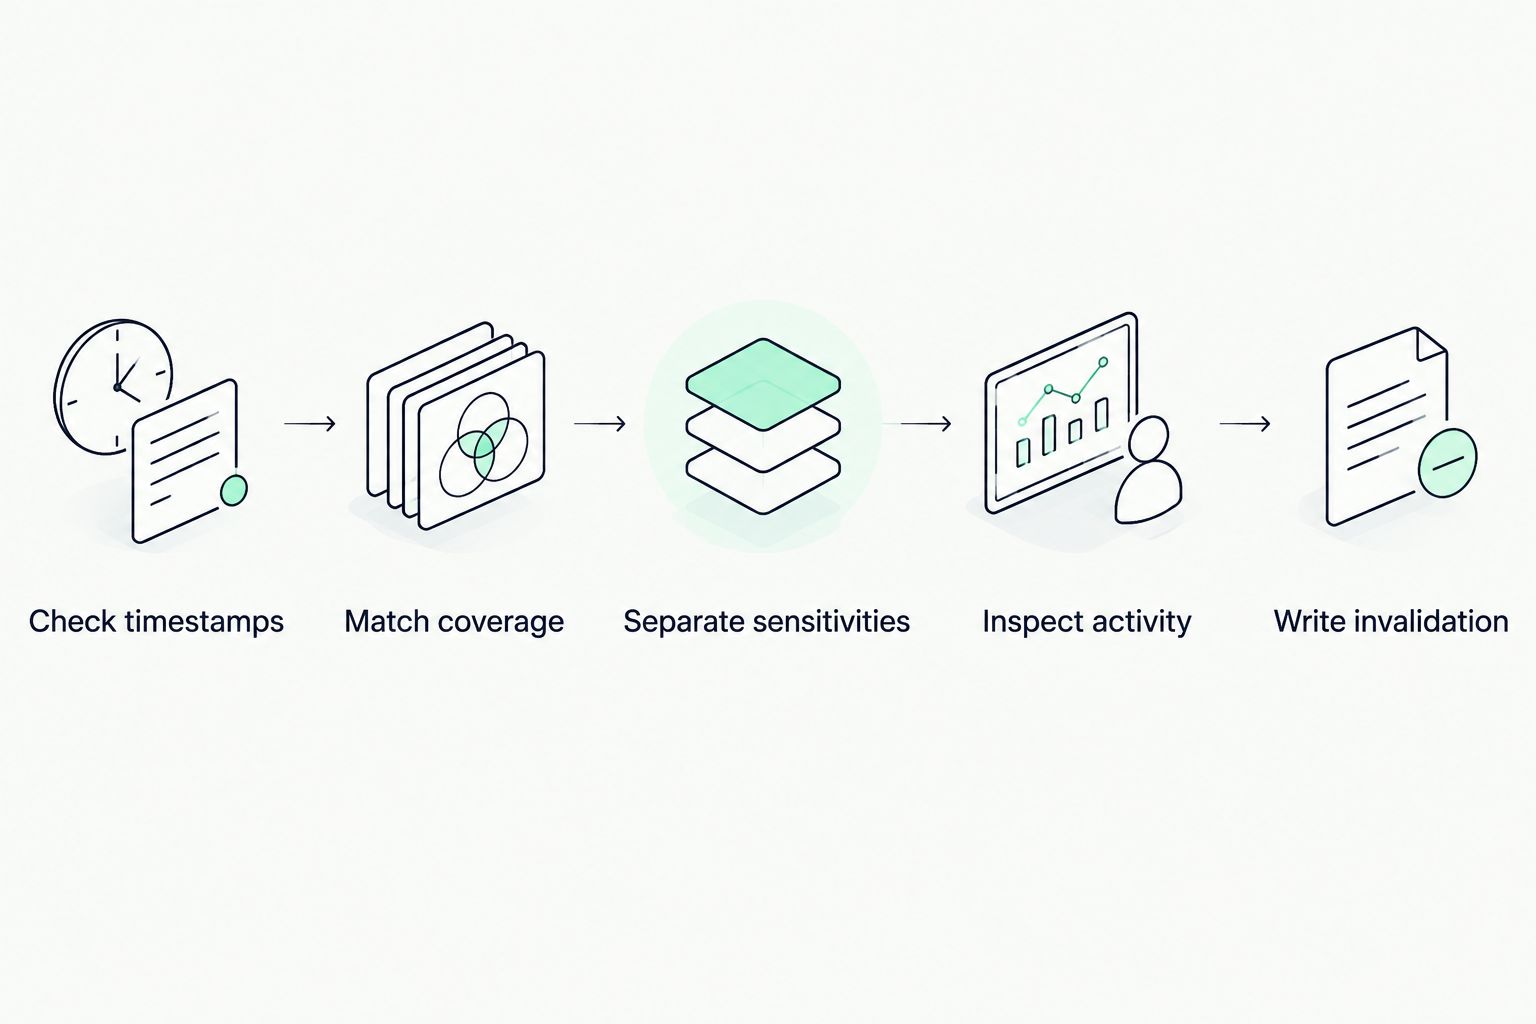
Use this sequence when reviewing a 2026 SPX gamma map. Check the inputs before interpreting the signal. A large-looking change is not useful if the comparison mixes different coverage or stale observations.
- Check timestamps. Identify when the exposure estimate was calculated and when its position inputs were last updated. A live calculation can still use older position information.
- Match coverage. Compare the same underlying, expiration selection, and strike coverage. An all-expiration map and a same-day-expiration map answer different questions.
- Separate sensitivities. Ask whether price, time, or implied volatility changed enough to alter the calculation. Do not label every update as new positioning.
- Inspect activity. Review transactions near the affected strikes, but distinguish reported trading from confirmed changes in outstanding positions.
- Write invalidation. State what observation would make your interpretation wrong. If no observation can disprove it, you have a story rather than a testable read.
Your written read does not need to be elaborate. Note the observation, the explanation, and what would contradict it. Keep the original note after the session, including the parts that failed.
That is public-accountability thinking applied to your own process: receipts, not a chart explanation rewritten after the move.
Can the gamma flip move without SPX breaking yesterday’s range?
Yes. A gamma flip is the modeled index level where estimated net gamma changes sign. It is not yesterday’s high or low, and it is not a physical barrier that price must cross before the estimate can change.
As the model’s inputs change, the estimated crossing point can move, disappear, or become less clear. Some exposure curves also have multiple sign changes, so a single headline flip level can hide useful detail.
For a 2026 chart review, distinguish between SPX crossing an existing flip level and the model recalculating that level around SPX. Those are different events. Neither proves the direction of the next move.
Does a call wall mean SPX cannot rise above it?
No. A call wall is a provider-defined level associated with a prominent concentration of call-option positioning or estimated exposure. Calls are options that give their holders the right to buy under the contract’s terms; providers do not all define a call wall identically.
The label can help you identify a strike to investigate. Its weakness is the implication of a solid barrier: a concentration of contracts is not an order guaranteeing resistance.
Check how the provider defines the wall and which expirations contribute to it. Then observe the index around that area rather than assuming the label has settled the outcome.
Do same-day options make yesterday’s map less reliable?
Same-day options make expiration coverage and timestamps especially important. 0DTE means zero days to expiration: the option expires that trading day. Near expiration, an option close to its strike can have very different sensitivities from an option farther away.
That does not mean every 0DTE trade moves SPX. It means an older snapshot can become a poor description of the current calculation, particularly when the index moves around relevant strikes.
An all-expiration map supplies broader position context, while a same-day map isolates contracts expiring that day. Neither view is automatically more useful; the right choice depends on the question you are asking. Compare like with like before declaring that gamma has changed direction.
What should you expect from a gamma terminal?
FlowMonkey suits retail index-options traders who want live gamma maps alongside real-time options flow alerts. Its stated coverage includes SPX, SPY, QQQ, and IWM. Those capabilities put modeled exposure and reported trading activity into the same research process.
The limitation matters just as much: a live map does not reveal every participant’s complete position or turn a model into a guaranteed forecast. FlowMonkey’s gamma-exposure terminal should support your explanation, not substitute for one.
If you evaluate the 7-day trial in 2026, use the same checklist each session. Can you explain the read in plain English? Can you identify its assumptions? Keep the misses visible alongside the calls that matched subsequent price action.
Review FlowMonkey after you understand those checks, not before. The useful next step is learning whether the terminal fits your research process—not treating a changing level as permission to take a trade.
FAQ
Can SPX gamma exposure change while the index stays flat?
Yes. SPX gamma exposure can change while the index stays flat because time, implied volatility, position inputs, and model assumptions affect the estimate. Flat index price does not freeze option sensitivities.
Does negative gamma mean SPX will fall?
No. Negative modeled dealer gamma describes a conditional hedging relationship, not a forecast that SPX will fall. Under the simplified model, hedging can follow price in either direction.
Is yesterday’s gamma flip still useful today?
Yesterday’s gamma flip is useful as a historical reference, not an automatically current level. Compare it with a current estimate using matching expiration coverage and documented timestamps.
Can options flow prove that dealers opened new positions?
Reported options flow alone does not prove that dealers opened new positions. A transaction does not reveal every participant’s existing holdings, related trades, or full hedging activity.
Should beginners watch gamma levels or price first?
Beginners should observe price and use gamma estimates as context. Define what would invalidate the interpretation before using either a gamma flip or a call wall in a trading decision.
Does FlowMonkey guarantee that its gamma levels will hold?
No gamma level guarantees a price reaction. FlowMonkey provides live gamma maps and real-time options flow alerts; those capabilities do not establish certainty about the next market move.
One last thing
A gamma level can move toward price without price moving toward the old level. That is why touching a recalculated line is not necessarily the same event as reaching yesterday’s marked level.
Save the earlier snapshot and its timestamp before comparing updates. Otherwise, a chart that keeps changing can make your interpretation look more consistent than it actually was. This article is educational, not a recommendation to trade options.